Solar power costs up to 3x as much as fossil fuels, nuclear and wind power
10/23/2020 / By Cassie B.

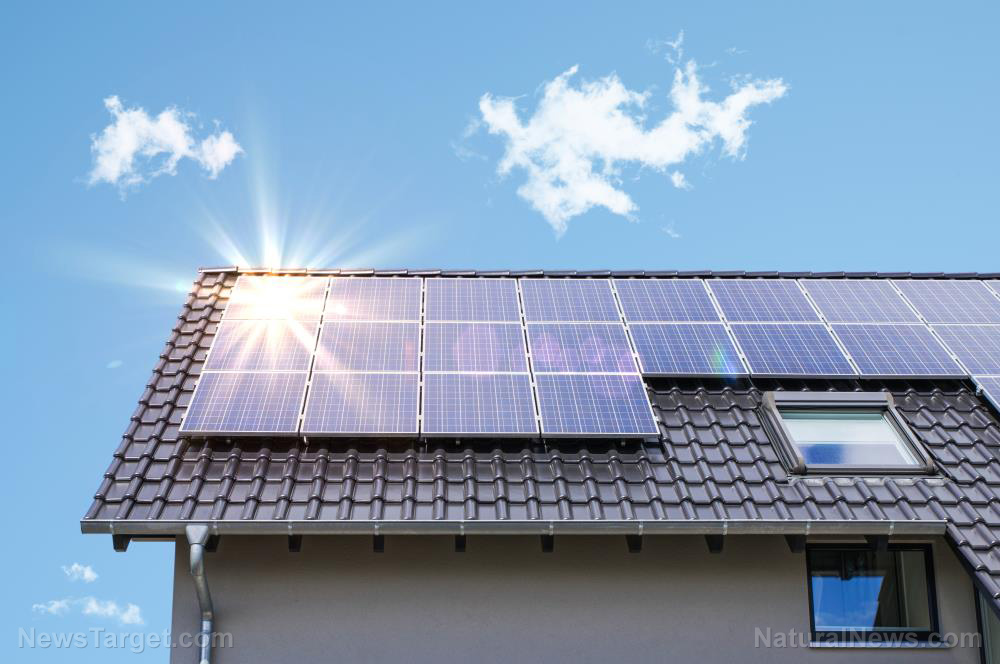
Solar power might sound like a great alternative to other types of energy on the surface, but when it comes to cost savings, the numbers might surprise you.
Last year, the average wholesale price in the U.S. for electricity generated using solar photovoltaic, or PV, technology was significantly greater than the average wholesale price for electricity from other sources.
According to the Power Operations Report from the U.S. Energy Information Administration, the weighted average wholesale price for electricity generated by solar PV was $83 per MW hour in 2019. This is more than double the price that was paid to producers of electricity that was generated by nuclear, fossil fuel or wind power. The wholesale electricity prices are the prices paid by electricity retailers like utilities to those who produce the electricity, such as the owners and operators of power plants.
This higher average price is being blamed in part on matters of timing and geography. Electricity prices change according to factors such as demand, the price of the fuels used to power plants, and the availability of the sources in wholesale markets. The prices that are being reported are calculated as the revenue received by generators in wholesale power markets, divided by the electricity generation of the technology; they do not include the cost of building power plants or generating the electricity.
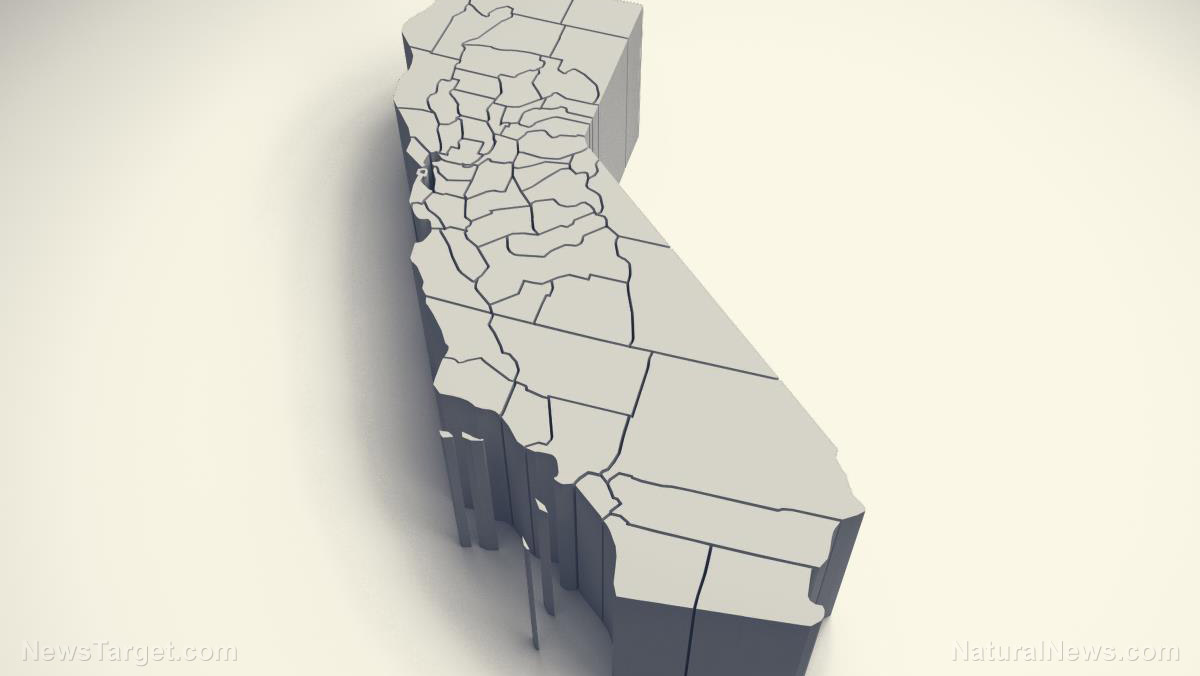
In California, where a third of all U.S. solar PV capacity is found, the average wholesale electricity price of all technologies was double the national average of $36 per MW hour at $74.00 per MW hour. However, the weighted average wholesale price for solar PV in the state was $100 per MW hour, which is 20 percent greater than the nation’s solar PV average.
Interestingly, the wholesale price that was paid for solar PV electricity in Kansas, Oklahoma, and Texas was lower than the average wholesale price of electricity from all sources in California. However, solar power’s price was still higher than power from other sources in those states.
The effect of the Duck Curve
The problem is that solar power works best around mid-afternoon, which is when both demand and prices are high. It then crashes as the sun goes down right before demand peaks as people return home from work, creating what is known as the duck curve. Of course, solar power does not work at all late at night when the demand is lowest.
The duck curve, which is named after its resemblance to the animal, is a visual depiction of the difference between electricity demand and the amount of solar energy that is available at various times throughout the day.
When the sun shines, solar power floods the market before dropping off just as the demand for electricity peaks in the evening. Solar power tends to displace other generation sources from around 9:00 in the morning until 5:00 in the evening. However, with the sunset, other sources need to ramp up ahead of peak demand, creating a steep ramp in the curve.
The duck curve is a transition point for solar energy. First published in 2013 by the California Independent System Operator, it was considered the first major acknowledgement on the part of a system operator that the use of solar energy is becoming more mainstream and that it’s time to start planning for higher solar energy usage, particularly in places like California, where solar power has made up as much as 40 percent of the electricity generated in a day at some points during the last year.
As solar power adoption continues to rise, utilities will need to balance the grid supply and demand. Electricity generators will need to ramp up their energy production swiftly as the sun sets and solar power’s contribution drops.
In addition, with high solar power adoption comes the possibility producing more of this type of energy than can be used. Over-generation would prompt system operators to stop PV generation, which would reduce its environmental and economic benefits. When this happens only once in a while, its impact is not dramatic, but as solar PV becomes more popular, its effects could be significant.
Sources for this article include:
Tagged Under: California, fossil fuels, green energy, green power, power grid, power problems, solar power, solar PV
RECENT NEWS & ARTICLES
COPYRIGHT © 2017 CALIFORNIACOLLAPSE.NEWS
All content posted on this site is protected under Free Speech. CaliforniaCollapse.news is not responsible for content written by contributing authors. The information on this site is provided for educational and entertainment purposes only. It is not intended as a substitute for professional advice of any kind. CaliforniaCollapse.news assumes no responsibility for the use or misuse of this material. All trademarks, registered trademarks and service marks mentioned on this site are the property of their respective owners.


